Events & Timeline (History, Charts, Logs)
Reading time: ~8 minutes · Execution time: none (this is a consultation page) · Audience: anyone who has the portal configured and wants to "see what happened" to the tank
🟡 Important Guide — a consultation page. You don't "configure" anything here: this is where you go to read and diagnose. Everything you do on other pages produces events here.
1. What the Events page is for
The Events page is your tank's black box: everything significant that happens is recorded here, in chronological order, with a severity level and a category label. Examples:
- 💧 ATO started at 03:42 for 35 seconds →
OKevent,plugcategory - 🌡️ Heater turned on for 8 minutes →
OKevent,plugcategory - ⚠️ Temperature probe "stuck" for 30 min →
Warningevent,sensorcategory - 🚨 ATO faulted due to
max_dose_seconds→Alarmevent,automationcategory - 🆘 Return pump stopped for 5 minutes →
Emergencyevent,plugcategory
On the same page, you can also see charts for the last 24h / 7d / 30d of the main metrics: temperature, levels, ATO activity, and plug status. Together with the timeline, they provide the "what was happening when" picture.
Typical use cases:
- 🔍 Post-diagnosis: "this morning the tank was at 27.2°C, why?" → look at the temperature chart + the night's events.
- 📈 Trend verification: "did the ATO top up too much in the last 7 days?" → count the activations in the chart.
- 🩺 General health: "are there alarms I didn't notice?" → filter for "Errors" on the events list.
- 🔄 Automation verification: "did the water change start last night?" → search for the "Water change started" event around the scheduled time.
In this guide, we will see how to read and filter the information on the page.
2. Open the Events page
From the JoyReef portal:
- Left menu → "Events" (timeline icon 📋)
- Or go to
portal.joy-reef.com/events
The "Events" page of the primary tank opens.
If an orange banner "Tank not selected" appears → primary tank missing (guide 04).
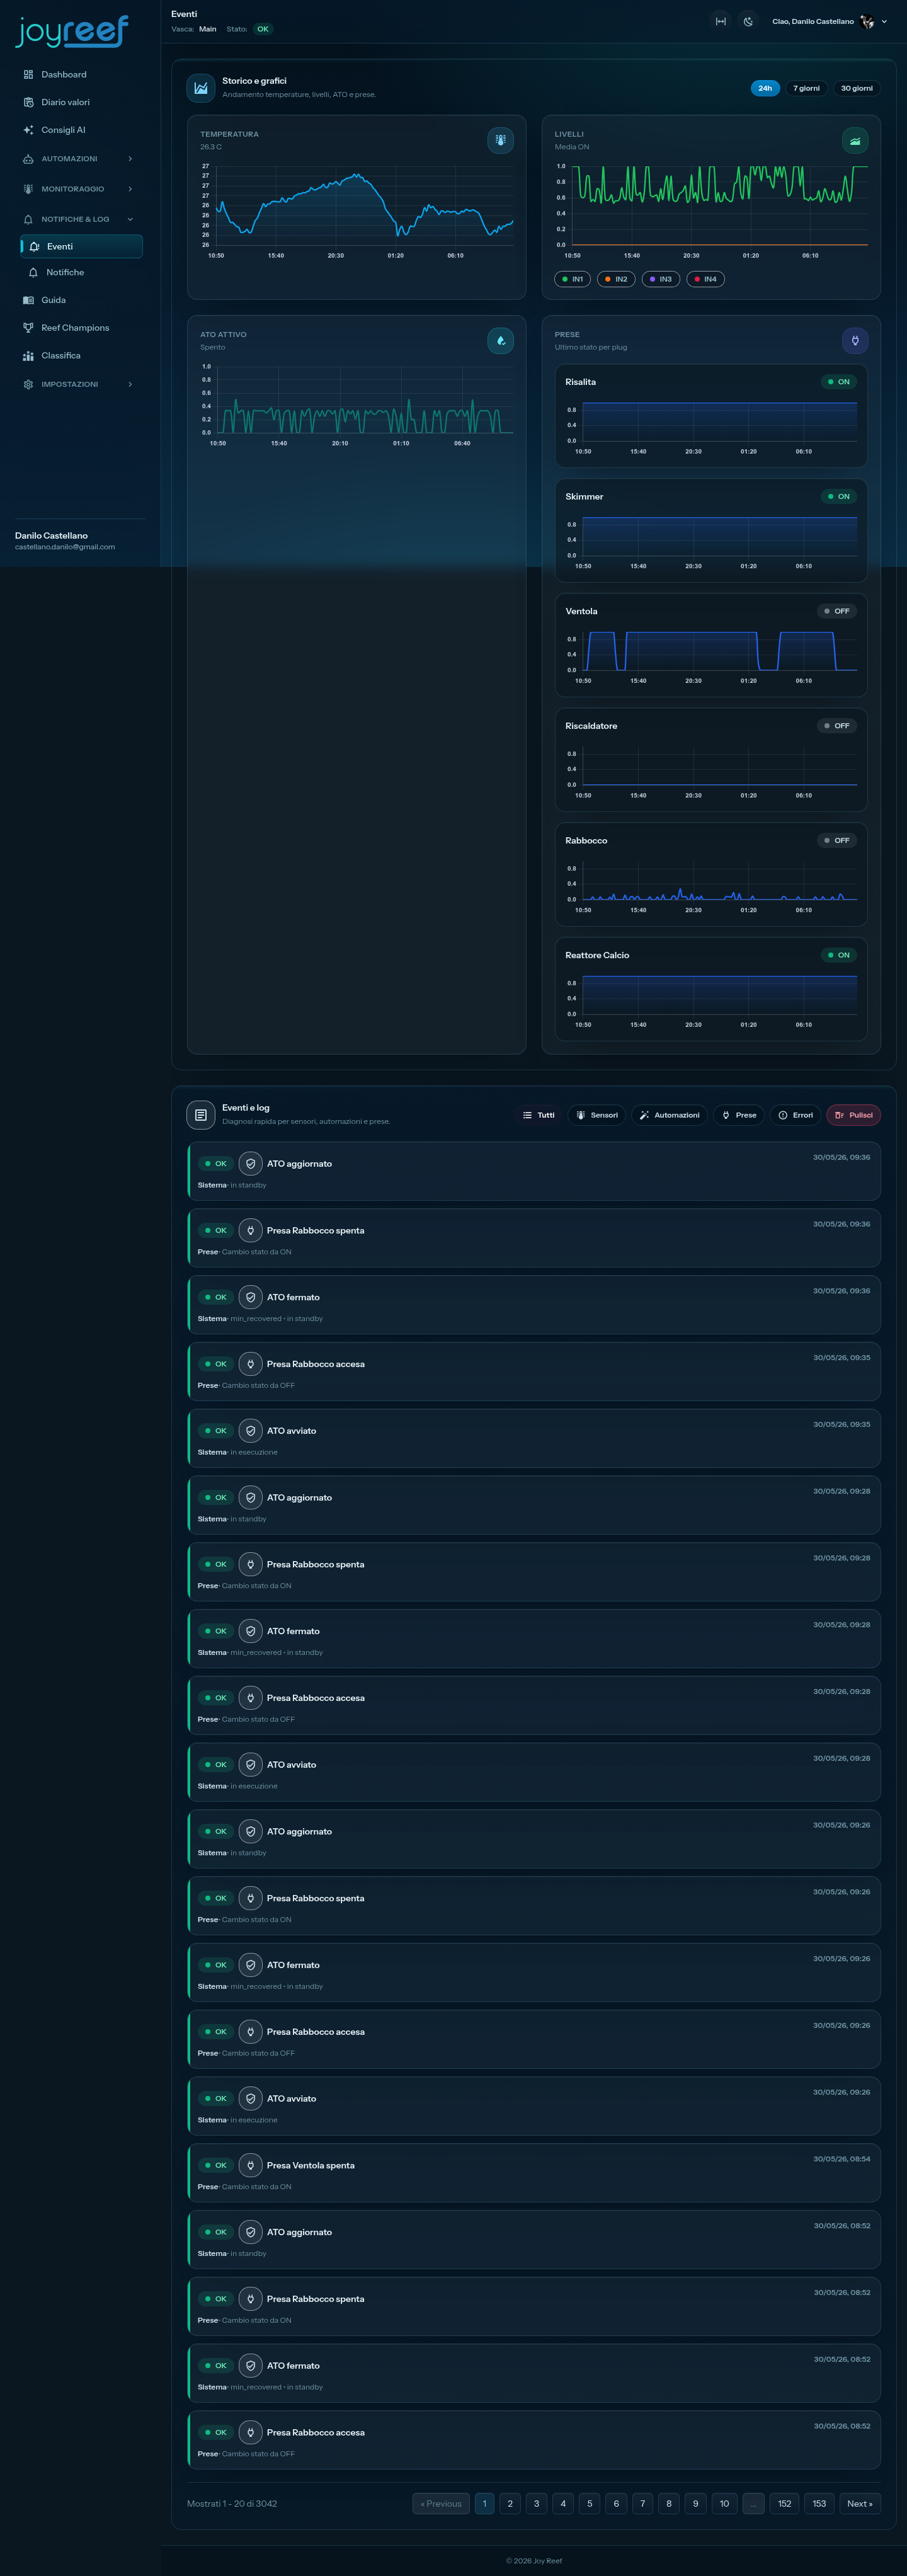
The page is divided into 2 main sections:
- History and Charts (at the top): metric trends
- Events and Logs (at the bottom): chronological list of events
Plus, potentially, an alert banner at the top if there is an active emergency (e.g., "ATO in fault" with a "Reactivate ATO" button).
3. "ATO in fault" Banner (when it appears)
When the ATO goes into fault for any reason (see guide 06), an amber banner appears at the top of the Events page with:
- Title "ATO in fault"
- The last update received from the controller
- "Reactivate ATO" button
Clicking "Reactivate ATO"
By clicking the button:
- You will see "Reactivating..." for a few seconds.
- The portal sends a command to the controller to unlock the ATO.
- A green confirmation banner: "ATO reactivated. Waiting for controller update..."
- The amber banner disappears when the controller confirms the new state (~10-30 sec).
⚠️ Do not unlock without understanding why: see guide 06 sec. 9 for possible causes. Unlocking blindly can lead to a second fault very quickly (= more RO water in the tank = salinity imbalance).
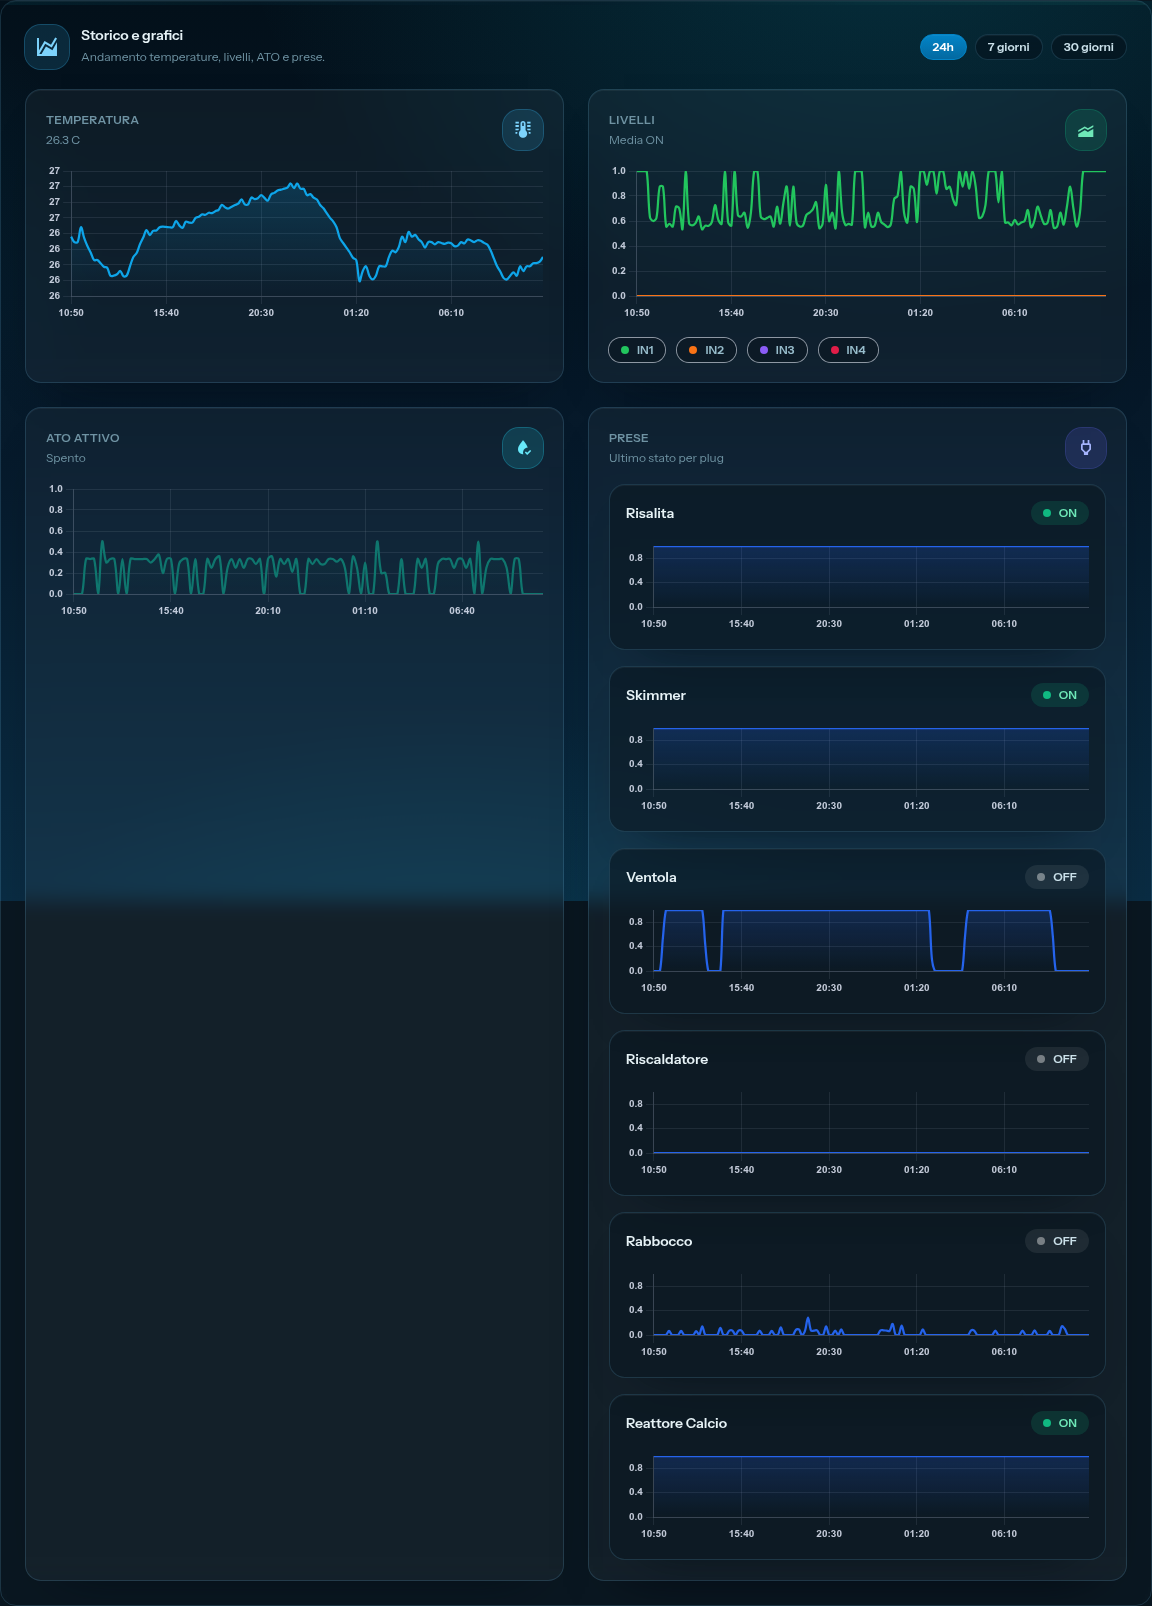
4. "History and Charts" Section
Time Range Selection
At the top right of the section, you find 3 buttons:
- 24h (default)
- 7 days
- 30 days
Click to change the period shown in the charts. The filter also applies to the events list below.
Temperature Chart
Shows the tank temperature in the selected range. Typically you see:
- One main line = main tank probe
- Any additional lines if you have multiple probes (e.g., sump, ambient)
What to look for:
- Flat curve within ±0.3°C of the target: everything is ok.
- Fluctuations > ±1°C: problem (hysteresis too high, probe exposed to drafts, underpowered heater).
- Downward spikes in the morning: normal if lights turn off at night and the room cools down.
- Slowly increasing or decreasing trend: seasonality or heater malfunction.
Levels Chart (Average ON)
Shows the tank float sensors as 0-1 values:
- 1 = sensor "active" (water present at the float)
- 0 = sensor "off" (water below the float)
- For readability, the chart shows the average over the period (not individual on/off switches).
What to look for:
- Sensors that should always be 1 (e.g., sump high sensor) → line always at the top.
- Fluctuating sensors (e.g., ATO low sensor) → "spikes" are seen every time the ATO triggers.
- A sensor that has been 0 for weeks = disconnected/faulty.
ATO Active Chart
Shows when the ATO topped up: short vertical bars (= seconds/minutes of delivery). What to look for:
- Regular spikes every 6-12 hours for a few minutes = healthy tank.
- Very frequent or very long spikes = leak or return pump causing waves.
- No spikes for days = ATO deactivated or minimum sensor always covered (tank too full?).
Plugs Chart
Shows the last known state for each smart plug. Rather than a continuous chart, it is a "who is on now" summary. Useful for confirming everything is in the state you expect (heater running, skimmer ON, etc.).
5. "Events and Logs" Section
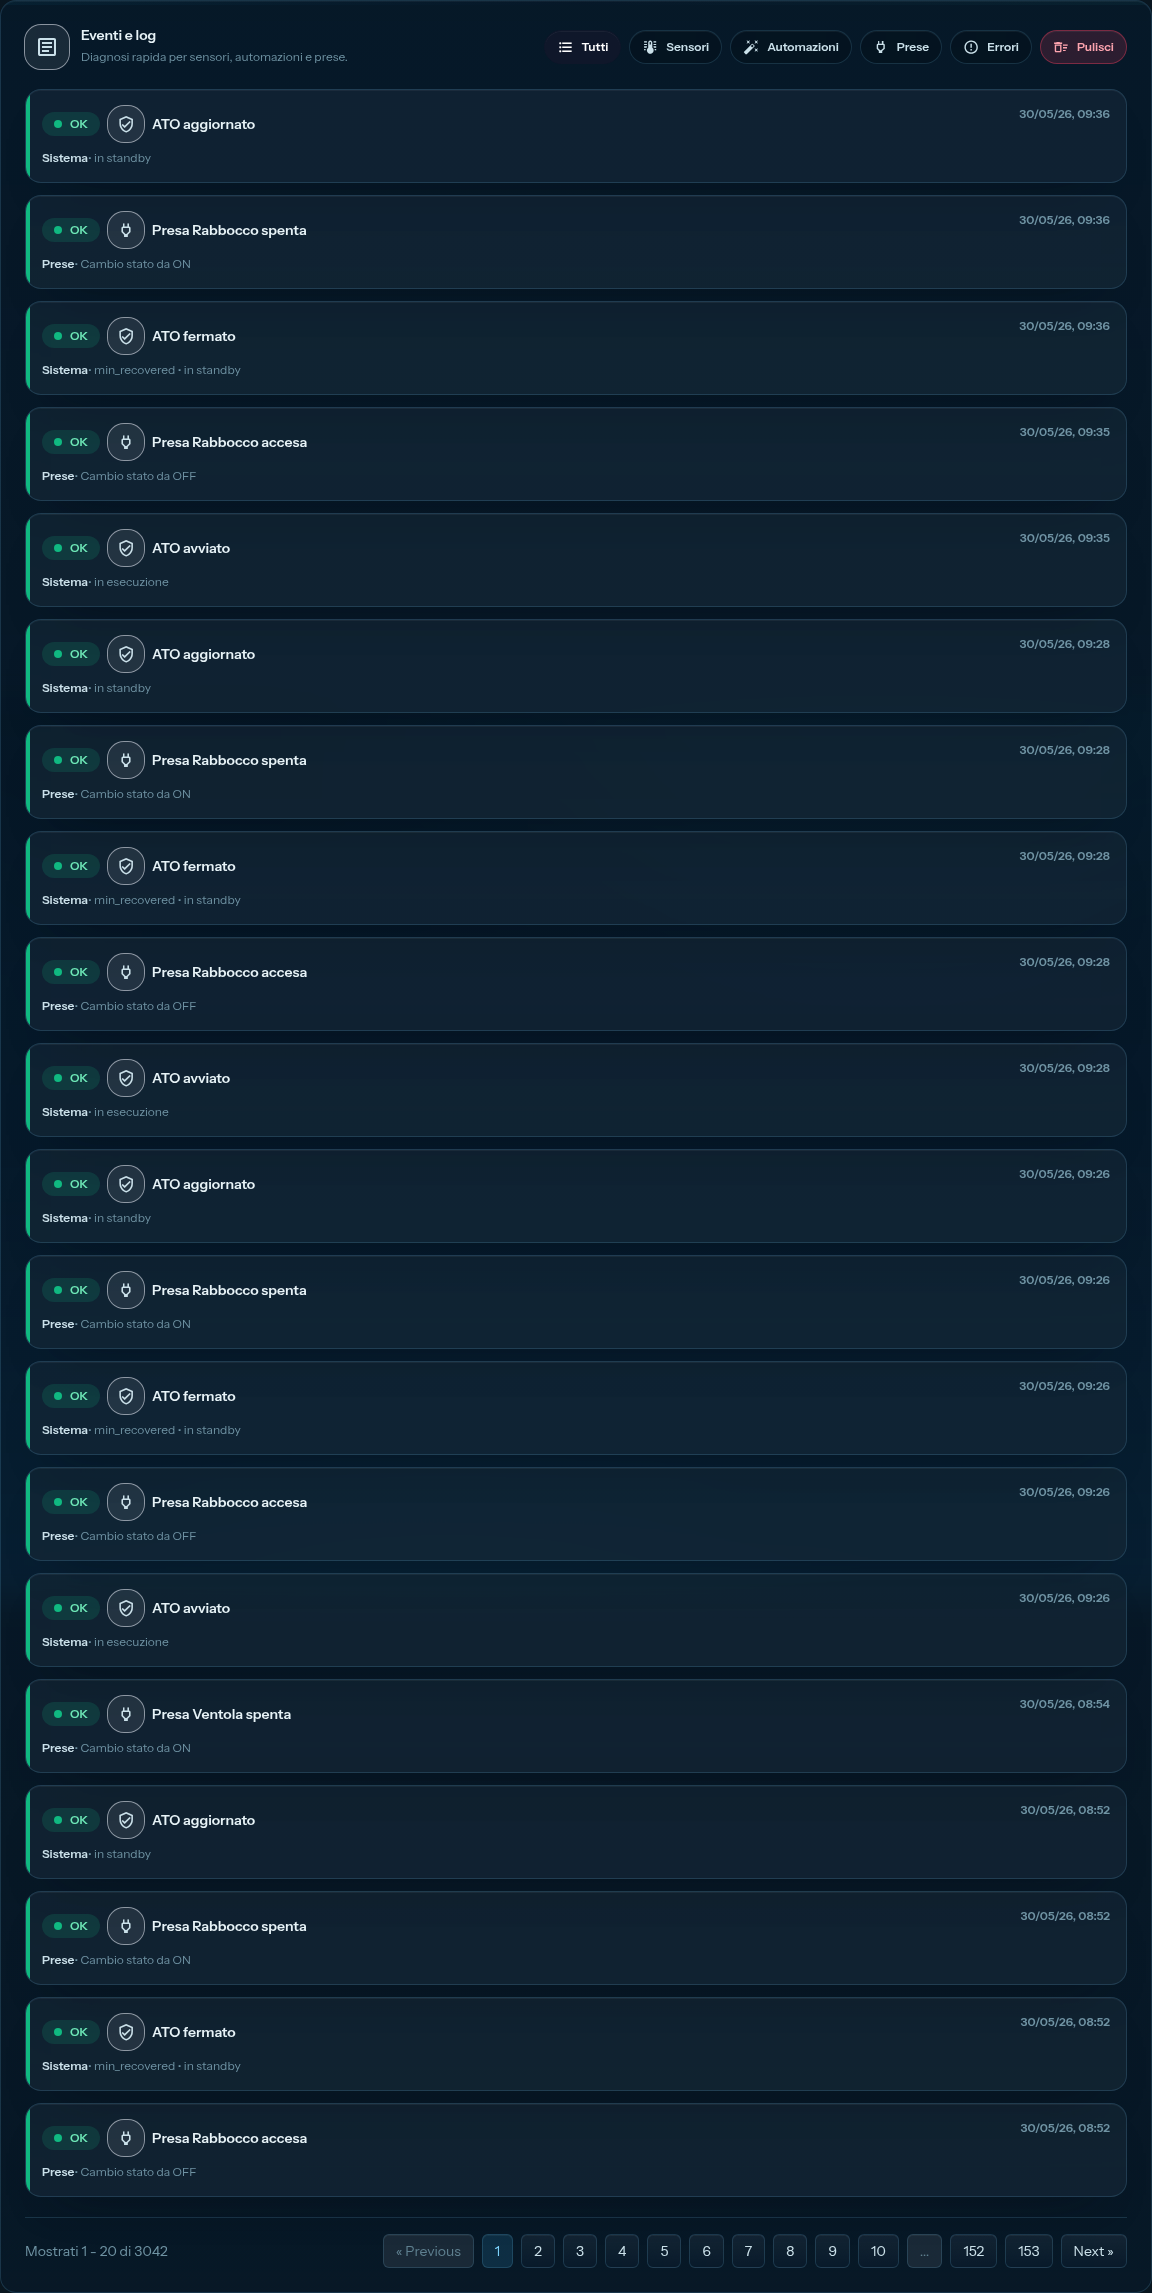
Chronological list of events for the selected period (same range as the charts above).
Category Filters
Below the title, you find 5 filter buttons:
| Filter | Shows |
|---|---|
| All | All events without distinction |
| Sensors | Events related to probes (anomalous reading, probe offline, calibration performed) |
| Automations | Events related to ATO, temperature, water change, reactor, etc. (start/stop/fault) |
| Plugs | Events related to smart plugs (on/off, offline, consumption alert) |
| Errors | ONLY Warning, Alarm, or Emergency level events (excludes OK) |
💡 For quick diagnosis: click "Errors" immediately and see if anything is wrong. If the list is empty → everything is ok. If there's something → read what happened.
Structure of an Event
Each event in the list shows:
[●] [LEVEL] [category-icon] Event Title
                            Detail (longer description)
                            Category · relative timestamp (e.g., "5 minutes ago")
Real example:
🟢 OK 💧 Plug "Heater" turned on
            State changed from OFF
            Plugs · 2 hours ago
🟠 Warning 🌡️ Temperature probe stuck
            Same value (25.3°C) for 35 minutes
            Sensors · 35 minutes ago
🔴 Alarm ⚡ ATO in fault: max_dose
            Pump on for 180s without level recovery
            Automations · 1 hour ago
Levels (color of the dot + left border)
| Level | Color | Meaning |
|---|---|---|
| OK | 🟢 Green | Informational event, everything normal. E.g., "ATO topped up 30s" |
| Warning | 🟠 Orange | Minor anomaly, to be monitored but not urgent. E.g., "Probe not updating for 5 min" |
| Alarm | 🔴 Red | Problem to be solved as soon as possible. E.g., "ATO in fault" |
| Emergency | ⚫ Black/Dark Red | Immediate danger to the tank. E.g., "Return pump stopped > 5 min" |
"Clear" Button
At the top right of the section, you find a "Clear" button (trash icon).
⚠️ Attention: clicking "Clear" deletes all tank events and logs irreversibly. A confirmation "Do you want to delete all tank events and logs?" will appear. Use it only if you know what you are doing (e.g., end of debugging, end of noisy initial setup, starting fresh).
Charts are NOT deleted: they are based on different, persistent metric tables.
Pagination
If there are many events, you will see "Showing 1-50 of 234" at the bottom with arrows to navigate the pages.
6. Common Patterns — What to look for when
"I have the impression something is wrong but I don't know what"
- Open /events
- Filter "Errors"
- Range "7 days"
- Read from the top (most recent)
If you find recurring patterns (e.g., "ATO in fault" every 2 days, "probe stuck" occasionally), there is a systemic problem to investigate.
"Temperature was strange this morning"
- Open /events
- Range "24h"
- Look at the Temperature chart: where is the deviation?
- Scroll the events list to the corresponding time.
- Search for events like: "Heater on/off," "Probe anomaly," "Maintenance mode activated."
"The ATO is not topping up"
- Range "7 days"
- Look at the ATO Active chart: do you see vertical bars? - No bars → ATO is not starting. Filter "Automations" and search for "ATO deactivated" or "ATO in fault." - Normal bars → ATO is starting but maybe it's not enough (water level continues to drop, anomalous evaporation).
- Filter "Sensors" → check if the ATO level sensor is active or has strange patterns.
"What is the weekly energy consumption?"
You can find this in the plugs chart or on the specific Energy & Health page (see guide 13), not on the events page. Here you see only the current state + specific state changes.
"Was there a blackout? For how long?"
- Range "24h" (or "7 days" for older blackouts)
- Filter "Sensors"
- Search for events like "Controller offline" / "Controller online" with close timestamps = that's the blackout.
- Duration: the difference between the two timestamps.
7. Current limitations of the page
Things the page does not do yet (useful to know so you don't look for them in vain):
- ❌ CSV/PDF export of events: for now, the list is only on-screen. If you need an export to share or archive, take a screenshot.
- ❌ Free text filter: you cannot search for "skimmer" or "max_dose fault" in the list. You must scroll or filter by category.
- ❌ Single level filter: the "Errors" filter includes Warning + Alarm + Emergency together; you cannot choose "Emergency only."
- ❌ Direct notifications from the page: to receive alerts via email/push, you must configure the Notifications page (guide 15).
- ❌ Customizable charts: the 4 charts are fixed; you cannot add one for "skimmer consumption" or "reactor pH." For those data, go to the specific sensor/device pages.
8. If something goes wrong
The list is empty even though I know things are happening
- Wrong primary tank → your devices are on another tank; change the primary tank.
- Range too narrow → increase from "24h" to "7 days."
- Active filter → ensure it's "All" or the correct one.
- You clicked "Clear" recently → events have been deleted, they start from zero.
I see events but they are all old (nothing recent)
- Controller offline → it's not sending new data. Go to Devices to verify.
- Browser has old cache → refresh the page (F5).
- Portal had a service interruption → refresh in a few minutes.
Events seem duplicated (same event multiple times in a row)
This happens for states that change rapidly (e.g., a float that oscillates slightly and activates/deactivates the ATO every 2 min). It's not a bug of the page; it's a behavior to analyze:
- Oscillating float: increase
activation delayin the ATO (see guide 06). - Drifting probe: recalibrate.
- Heater with too frequent cycles: increase hysteresis (see guide 07).
The "ATO in fault" banner doesn't disappear after "Reactivate"
- Wait 30 sec (the controller must confirm via MQTT).
- Controller offline → the reactivation signal doesn't reach it. Restart it.
- Cause of fault not resolved → it will fault again immediately. Go to the ATO page to read the
reasonand understand what to resolve.
9. Next step
You have explored the events page. To receive notifications of serious problems without having to check manually, configure the notifications:
➡️ Guide 15 — Email/Push Notifications
💡 Recommended routine: every morning open /events, filter "Errors," range "24h." 30 seconds that tell you if the night went smoothly. For those who want full automation: configure email notifications (guide 15) and receive alerts even without opening the portal.